Latest version:
7.83.998
Latest version:
7.83.998

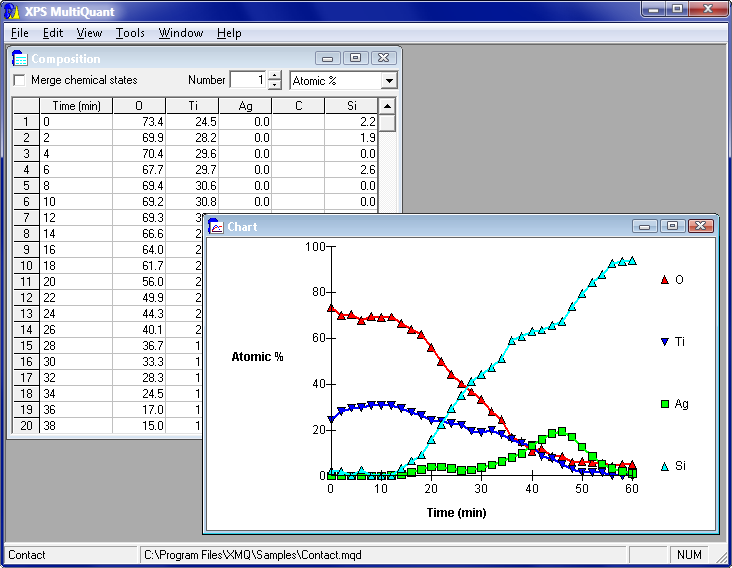
Results, e.g., depth profiles, can be presented on charts. The Chart window is attached to the Results window. Any combination of results type (Y axis) and experiment labels (X axis) can be selected. Series (elements) or points (experiments) can be omitted, if necessary. When the sputter rate of the ion etch is known, the time scale can be easily converted to depth.
| Click the Convert time to depth box (located in the Label tab of Parameters window) to see the action. |

|